| Financial period | Apple Sales | Kodak Sales |
| FY 2005 | 13,931.00 | 11,395.00 |
| FY 2006 | 19,315.00 | 10,568.00 |
| FY 2007 | 24,006.00 | 10,301.00 |
| FY 2008 | 32,479.00 | 9,416.00 |
| FY 2009 | 42,905.00 | 7,609.00 |
| FY 2010 | 65,225.00 | 5,993.00 |
| FY 2011 | 108,249.00 | 5,148.00 |
| FY 2012 | 156,508.00 | 4,114.00 |
| FY 2013 | 170,910.00 | 2,349.00 |
| FY 2014 | 182,795.00 | 2,046.00 |
| FY 2015 | 233,715.00 | 1,709.00 |
| FY 2016 | 215,639.00 | 1,543.00 |
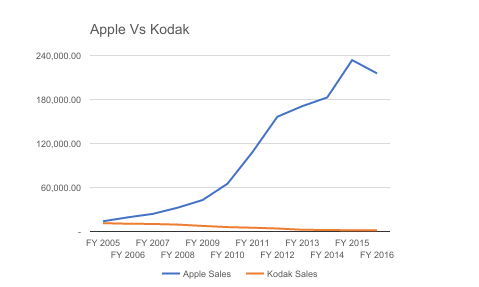
So, would you rather be Apple or Kodak?
Here’s a taste of what kind of difference we can make to your company.
| Sector | Mass production: Healthcare |
Mass production: Automotive |
Service Industry: Rail |
Service Industry: Communications |
|
| Tools | Brainstorming | 5 S | 5 S | Brainstorming | |
| Value stream mapping | Takt time | Visual Mgt/Daily Huddle/KPIs | Process Mapping | ||
| Pareto Analysis | Value Stream Mapping | Process Mapping | 5 S | ||
| 5 S | TPM | Practical Problem Solving | Visual Mgt/standardization | ||
| Benefits | Manufacturing time | 42% decrease | 38% decrease | N/A | N/A |
| Manufacturing costs | 20% decrease | 12% decease | N/A | N/A | |
| Materials/labour costs | 16% decrease | 14% decrease | 12% decrease | 7% decrease | |
| Schedule Adherence | 21% increase | 28% increase | 34% increase | 4% decrease | |
| Inventory Levels | N/A | 9% decrease | 41% decrease | N/A | |
| Sales | N/A | 31% increase | N/A | 11% increase |